

Net zero could be sped up if oil, coal and gas capital costs were to rise
Energy transition specialists argue that the cost of capital for dirty energy sources should go up to hit net zero
The cost of capital for energy sources such as coal, oil and gas has largely flatlined in the US, according to new findings.
However, if they were to rise, the energy industry would be encouraged if not forced to look at cleaner energy sources, thereby accelerating the path to net zero, according to a new report by the Energy Transition Risk and Cost of Capital Programme (ETRC).
“In North America, the cost of capital for renewables electricity is similar or comparable to the level of fossil fuels, and the same trend is found in cost of equity," said Xiaoyan Zhou, lead for Sustainable Finance Performance at the Oxford Sustainable Finance Group, publishers of the report.
"In short, there's not much clear distinctions between low carbon and high carbon electricity in the cost of capital in the North American market," Zhou stressed.
Cost analysis
The Oxford Sustainable Finance Group claims the report to be the most comprehensive analysis of cost of capital trends across the global energy sector over the past two decades.
The results from North America contrasted with that of Europe, which showed that low-carbon electric utilities have a lower cost of capital than their high carbon peers. This trend was found to consistent across types of capital such as debt vs equity.
Zhou also pointed to research from the ETRC which showed a direct link between the decreased cost of capital for renewables projects in Europe and increased regulation encouraging renewables investment compared to the US.
This may be subject to change however, with the green subsidies included in the US Inflation Reduction Act.
There's not much clear distinctions between low carbon and high carbon electricity in the cost of cost capital in the North American market.
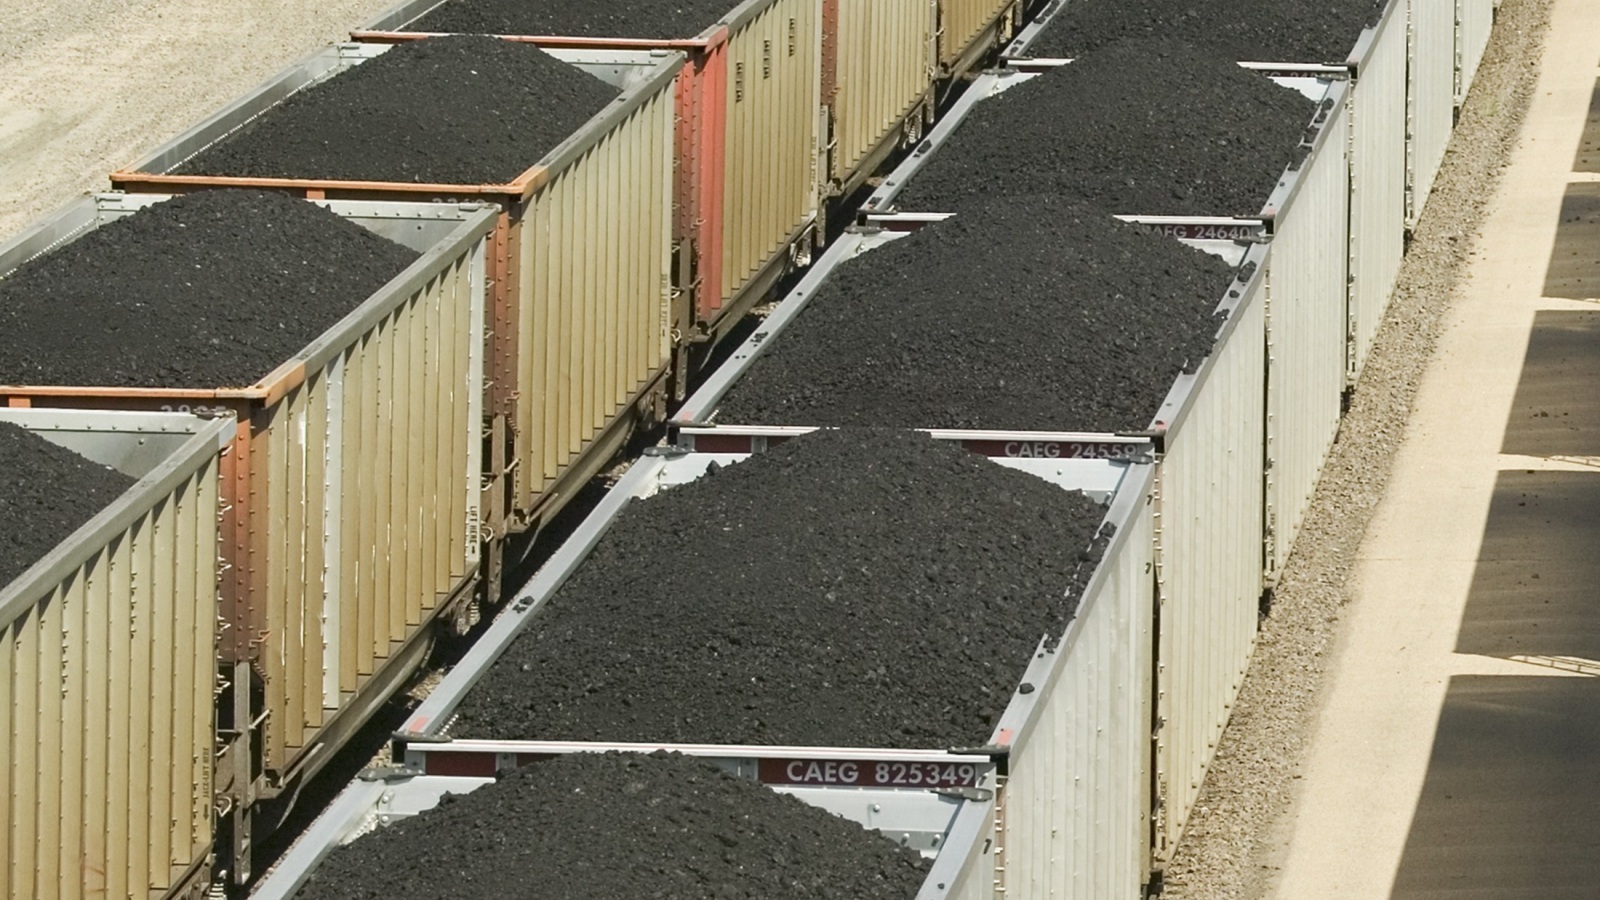
Oil and gas exploration
Across geographic regions, the report did however show a rising cost of capital for new oil and gas exploration.
Christian Wilson, a research assistant at the Oxford Sustainable Finance Group and a co-author of the ETRC report, said: “There’s an increasing gap in many cases between upstream activities and the rest of the oil and gas sector. We would expect a higher cost of capital in general because these this kind of the sub sector is riskier, but it's more comprehensive than that.
“It's interesting seeing this gap grow in recent years. This could reflect nvestor caution about funding in new rounds of oil and gas expansion and further capex.”
In North America, since 2015, exploration & production has observed the highest cost of debt, rising to 9.3% in 2021, while oil & gas drilling rose to 8.2%.
With regard to cost of equity in 2021, there hws been a steady rise since 2016, with exploration & production and refining being in 2021 the highest subsectors at 14.7% and 15.1%, respectively.
Earlier this year, data produced for NGOs including Sierra Club, BankTrack and Rainforest Action Network showed that large banks are continuing to provide significantly more finance towards oil and gas projects than renewables.


