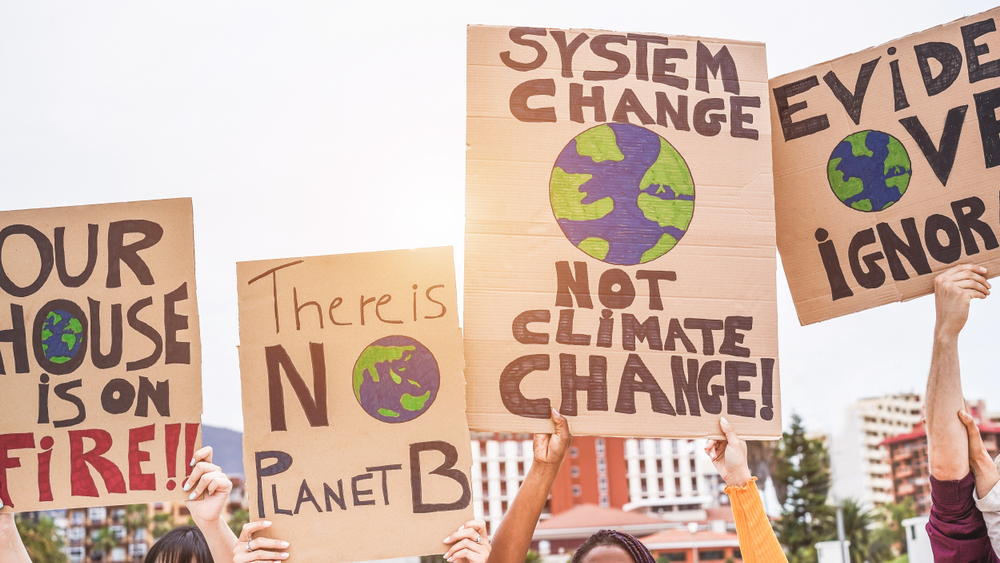
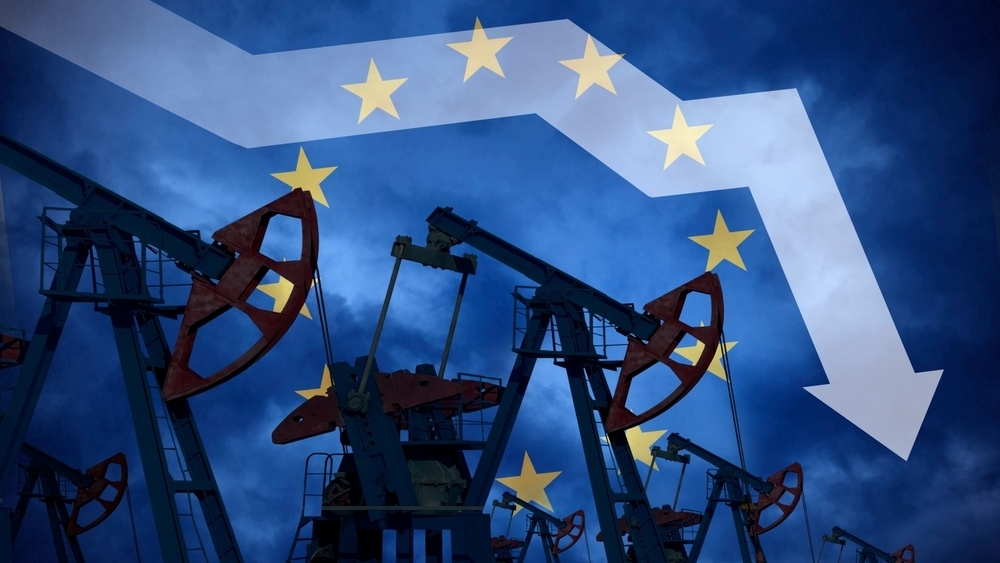
Why we urgently need to reform investor compensation rules to ‘transition away’ from fossil fuels
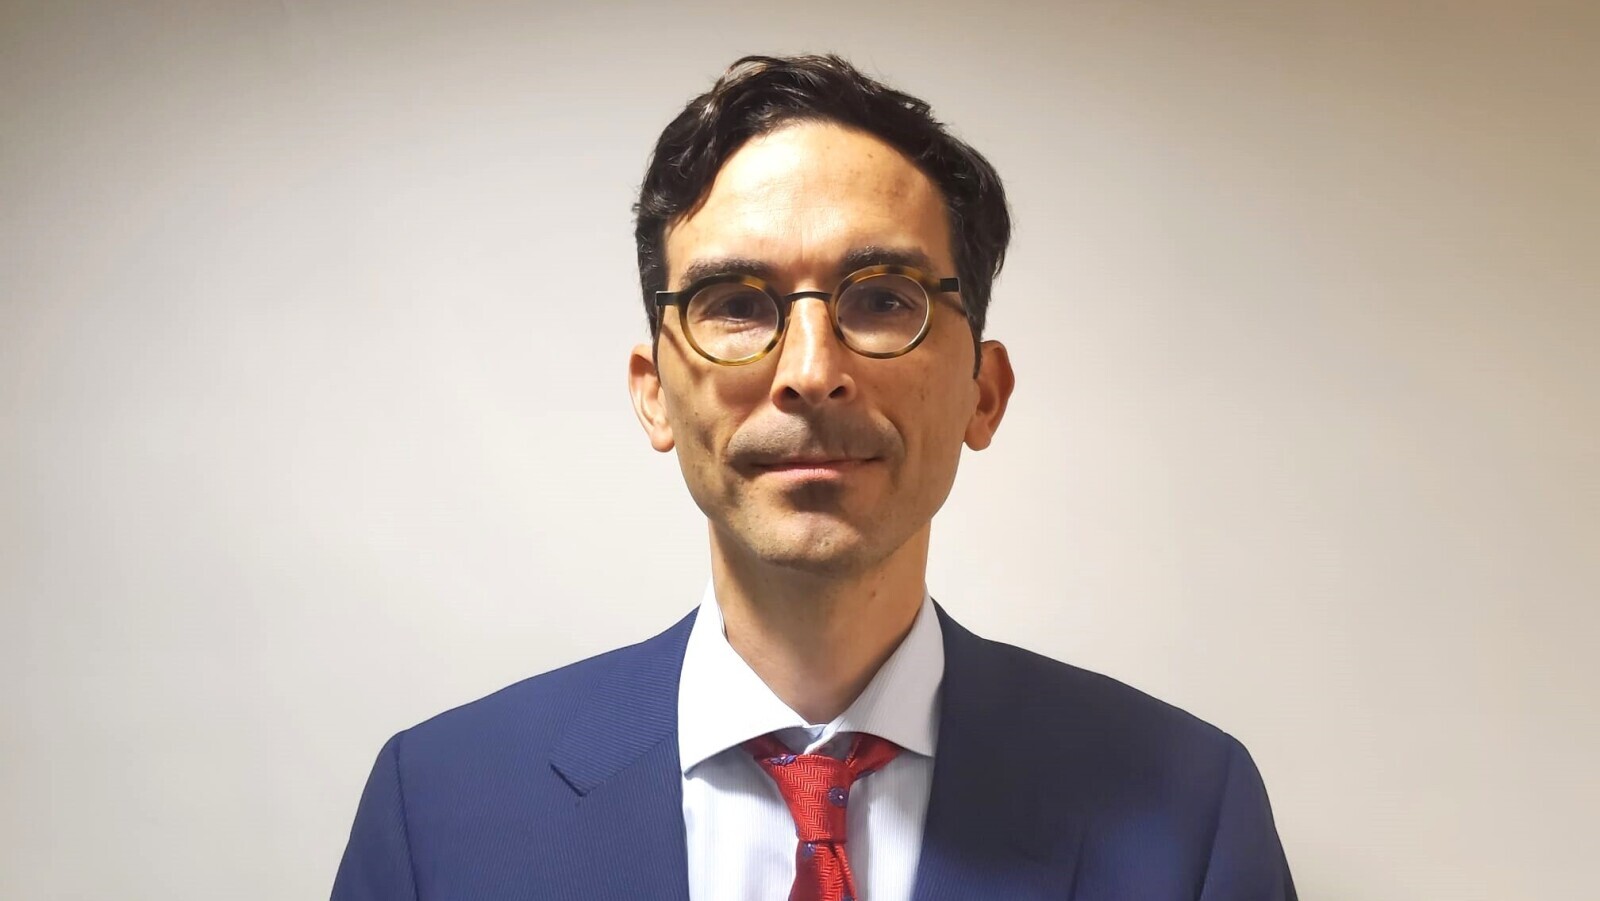
Anatole Boute, professor at the Chinese University Hong Kong specialising in Energy Law argues that current investor compensation rules do not yet accurately value the cost of the energy transition